LLM Evals Lesson 2 Error Analysis
Notes from lesson 2 of Hamel and Shreya's LLM evaluation course - covering error analysis, open and axial coding, and systematic approaches to understanding where AI systems fail.

- David Gérouville-Farrell
- 8 min read
The second lesson of Hamel Husain and Shreya Shankar’s LLM evaluation course tackled the “Analyse” phase of their evaluation lifecycle. This session focused on systematic error analysis - moving beyond gut feelings and random fixes to understand precisely where and why LLM applications fail.
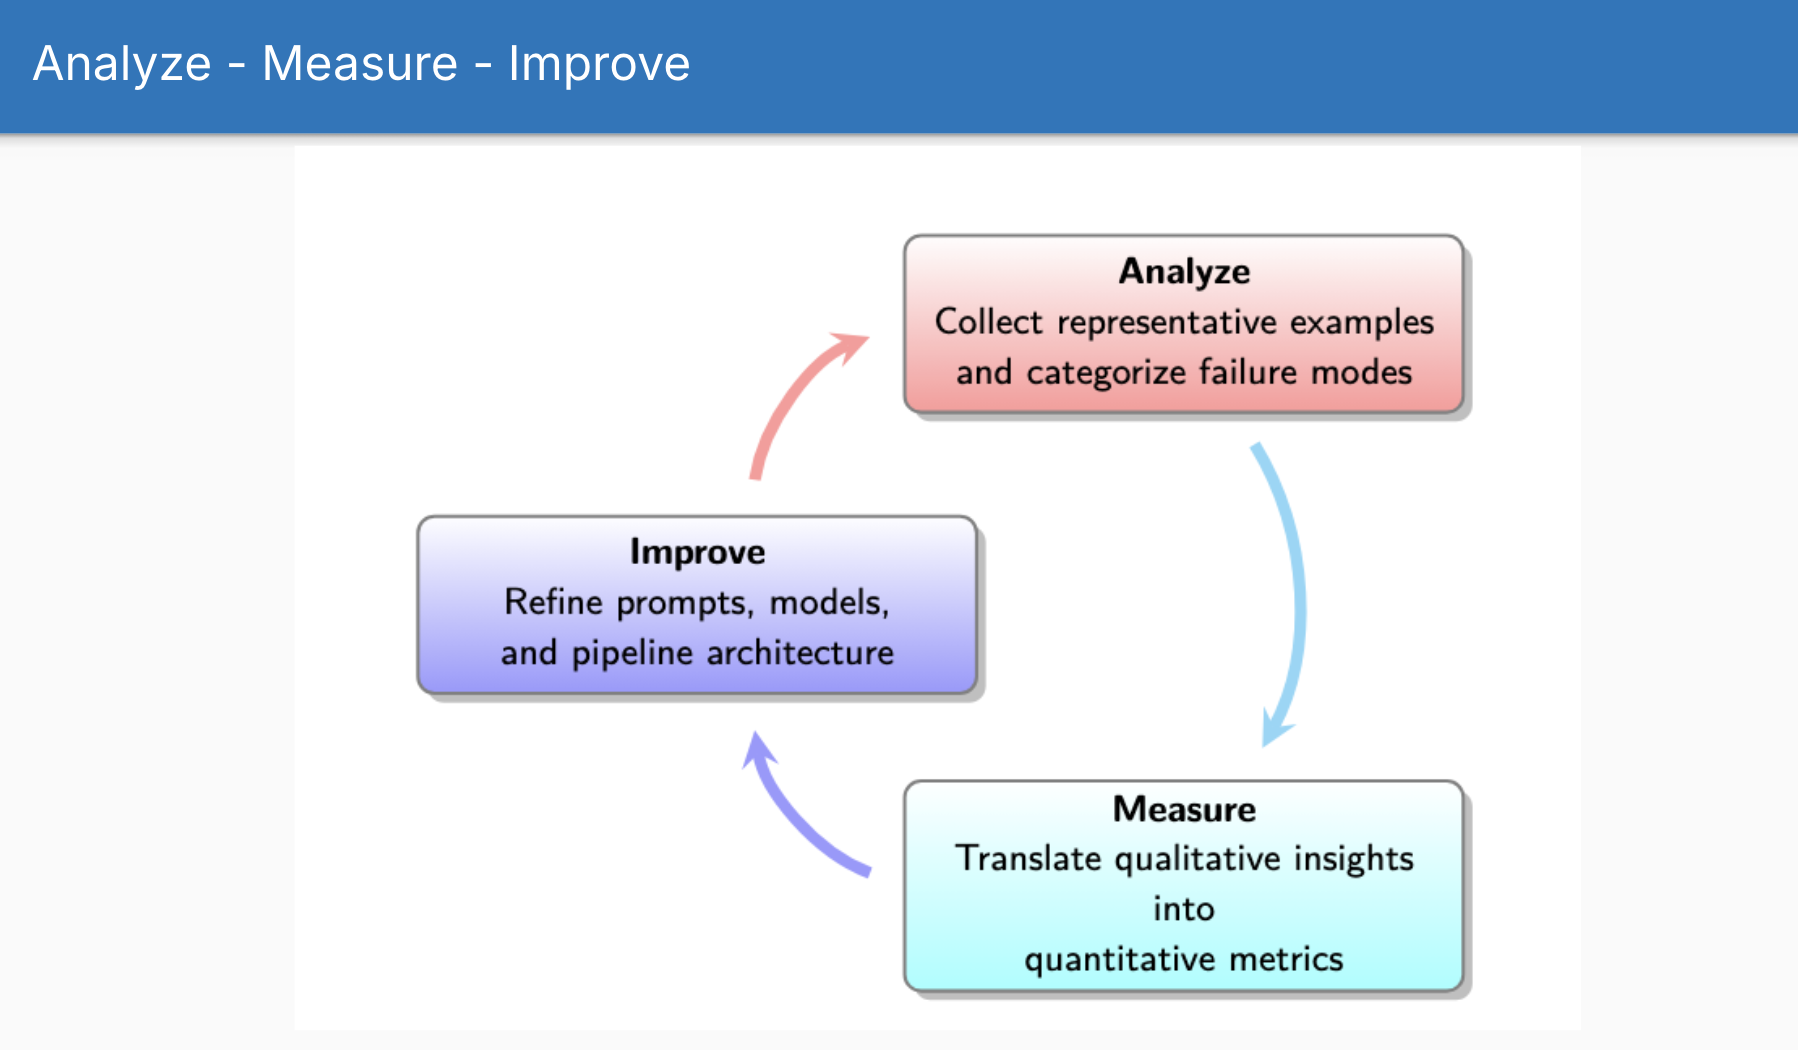
If you’re going to make something better, you need to understand how it fails and error analysis focuses on that.
Throughout this lesson, Shreya and Hamel used NurtureBoss as an example. It’s a previous project that Hamel worked on in the real world. The company is building AI assistants for apartment leasing. Their system handles complex interactions - scheduling tours, checking availability, managing resident queries - with over 10 different tools and multimodal capabilities.
The Five Stages of Error Analysis
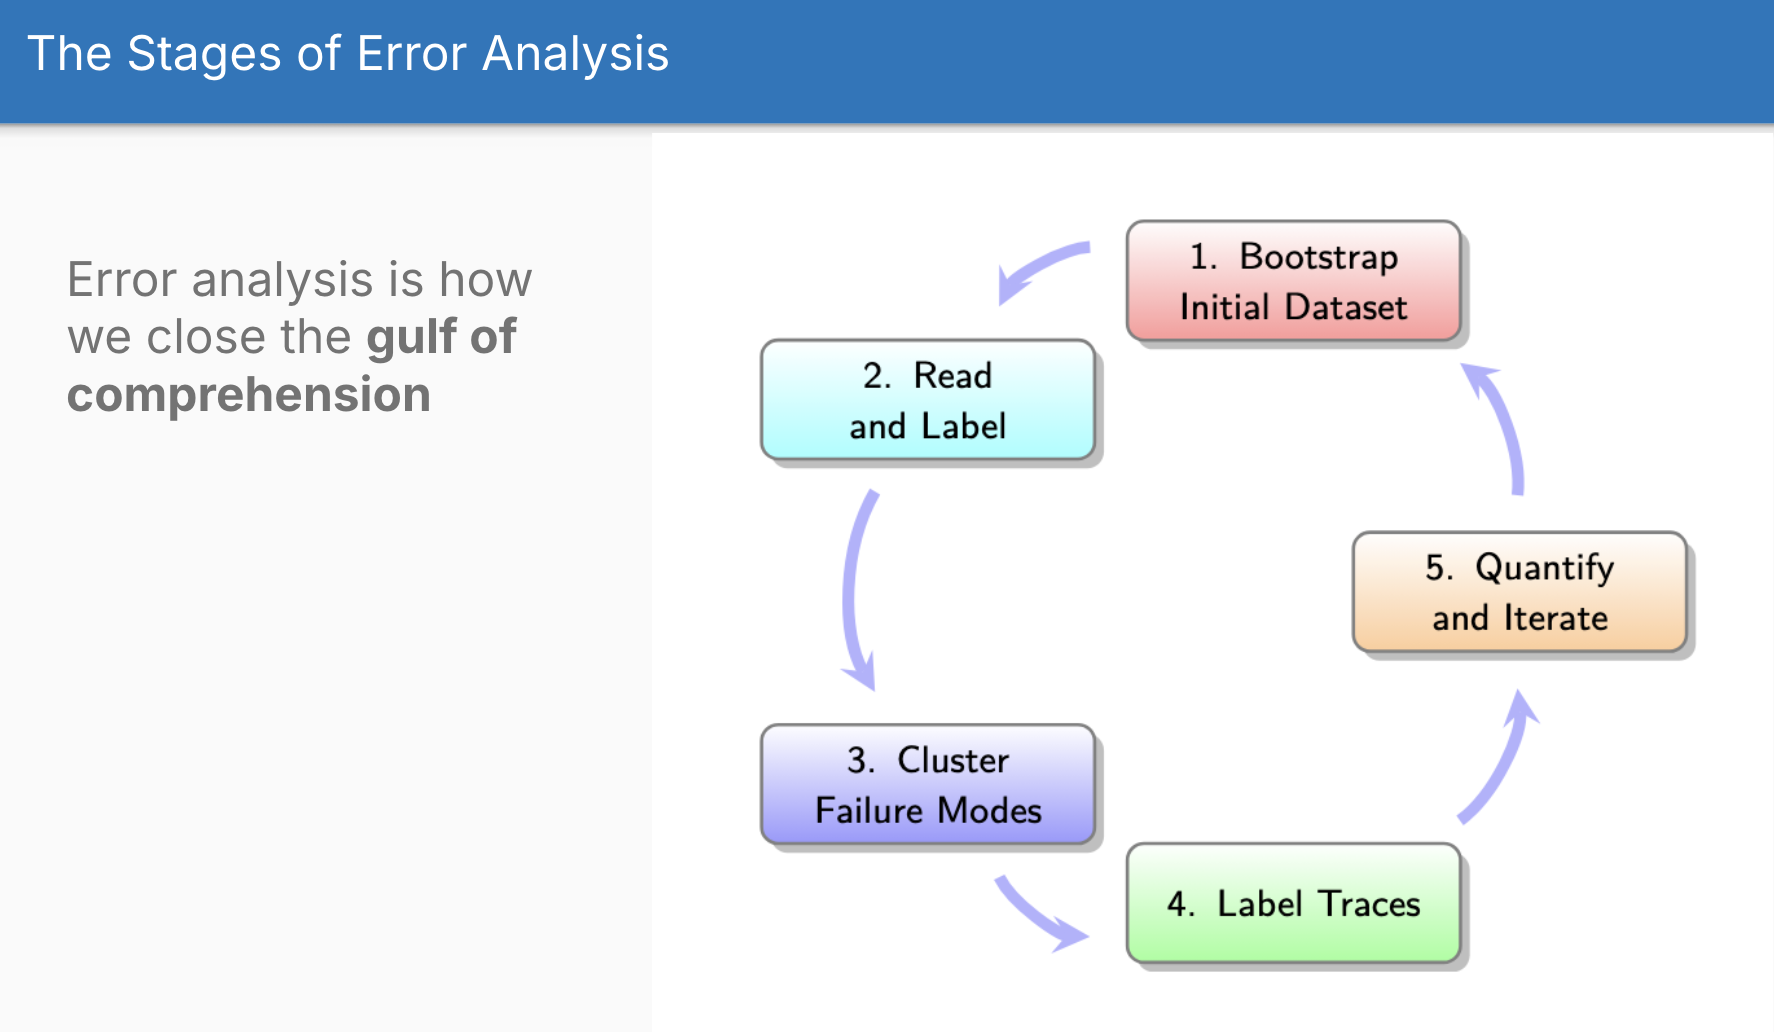
The error analysis process breaks down into five connected stages:
1. Bootstrap Initial Dataset (i.e. actually good synthetic data)
The first challenge: where do you get data for analysis when you haven’t deployed yet?
If you ask an LLM to generate user queries, they’re not going to be very representative of the genuine mix of data that you’re going to see in the real world. The LLM doesn’t necessarily know the distribution of your data - it’s going to create probably something closer to the mean rather than anything that represents the true shape of your data.
So you have to come up with a technique that is going to result in generating a better dataset, a dataset that better represents how you expect people to use this product. Hamel and Shreya recommend a structured approach based on sampling among dimensions.
What they’re talking about are different aspects of the query space that are meaningfully different. Rather than hoping an LLM will magically think of diverse scenarios, you explicitly identify the axes along which real usage differs.
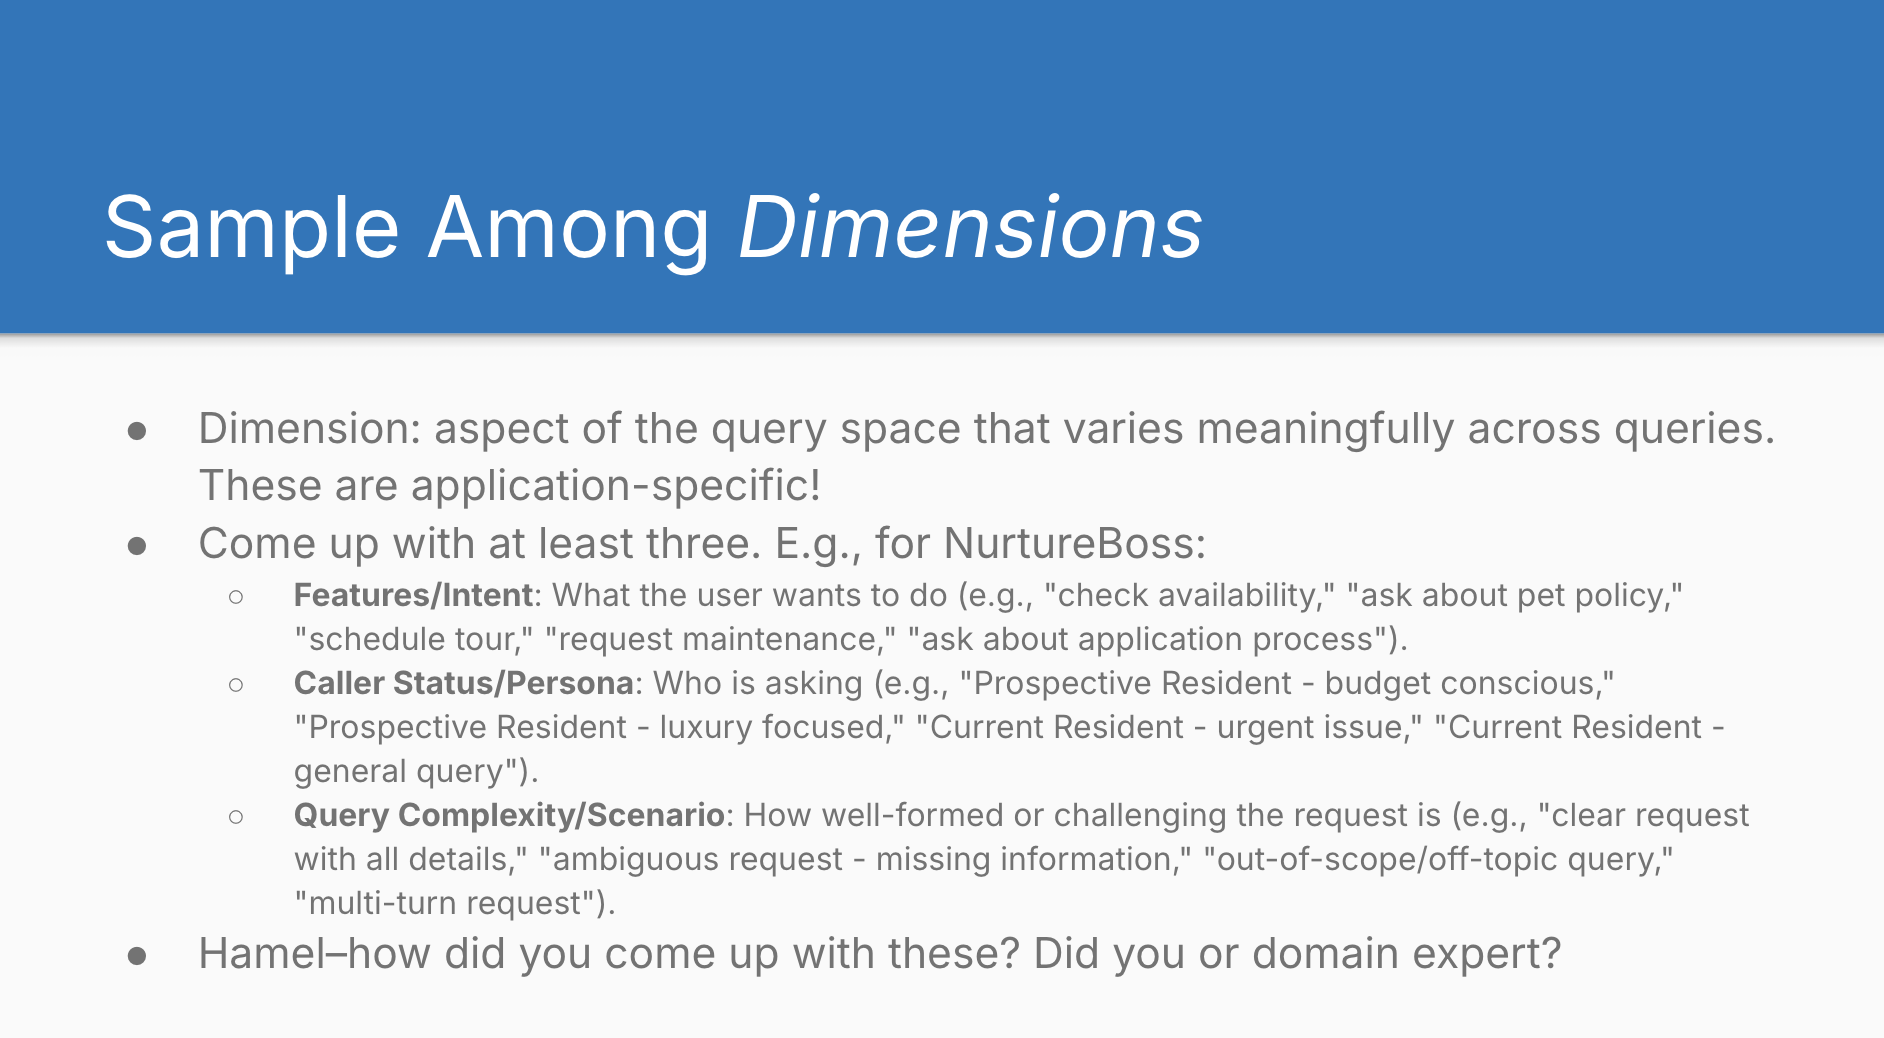
For NurtureBoss, they identified three key dimensions that vary meaningfully across user queries:
- Features/Intent
- What users want to do (check availability, schedule tours, request maintenance, ask about application process)
- Caller Status/Persona
- Who is asking (prospective resident who’s budget-conscious, prospective resident who’s luxury-focused, current resident with urgent issue, current resident with general query)
- Query Complexity/Scenario
- How well-formed the request is (clear request with all details, ambiguous request missing information, completely out-of-scope or off-topic, multi-turn request)
As Hamel noted, there are infinite possible dimensions. The point isn’t to enumerate all of them, but to anticipate which dimensions are likely to induce failures. You’re trying to focus on the dimensions with high signal - the ones that are more likely to trigger problems or push the system’s boundaries. The complexity dimension, for instance, is universally applicable because people love submitting ambiguous queries, and how you handle those ambiguous cases varies significantly by application.
The process works in two steps:
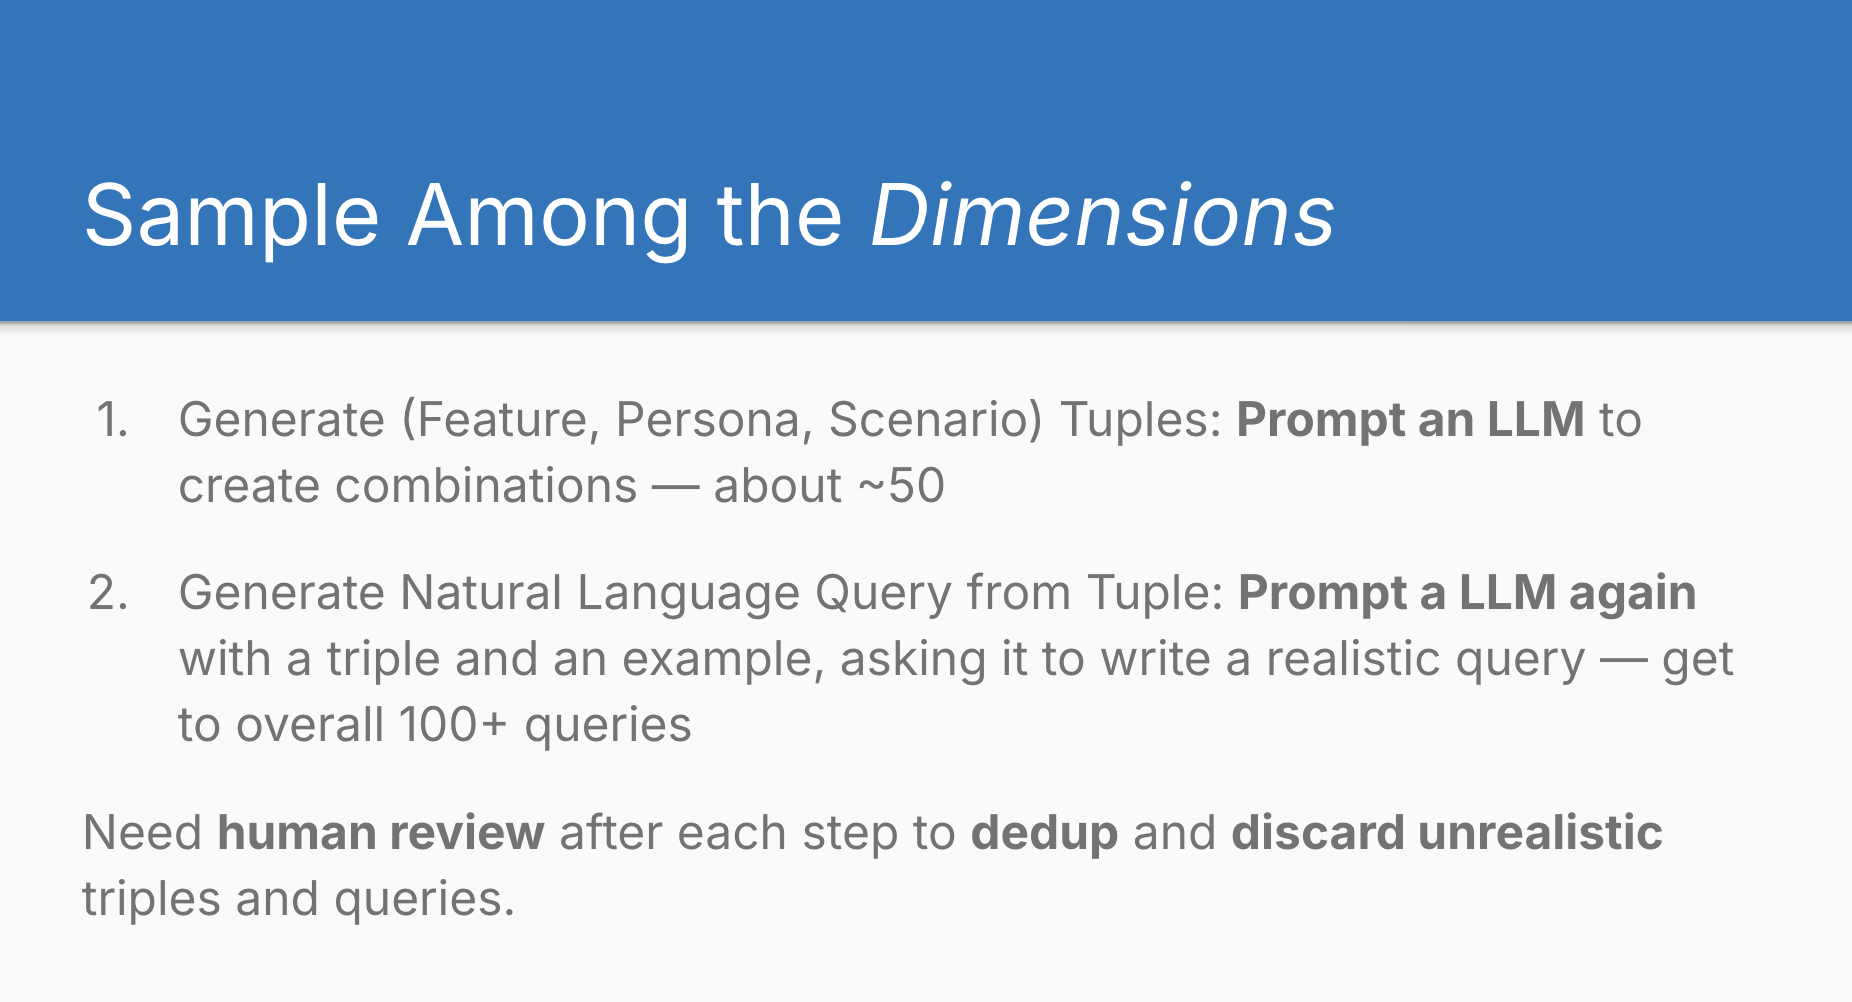
- Generate feature combinations
- Prompt an LLM to create 50+ combinations of your dimension values
- Generate natural language queries
- Use another prompt to convert each combination into realistic user queries, aiming for 100+ total queries
It’s this structured process that makes it more likely you’ll end up with a representative dataset. The combination of rigorous, step-by-step methodology with LLM capabilities is what makes it work. You think through the different dimensions you care about, get an LLM to iterate through those combinations systematically and thoroughly, then work through them one at a time to generate the actual queries.
Without this structure, you end up with what I’d call “procedurally generated soup” - lots of variation that all tastes the same. You want data that pushes all the boundaries of your dimensions, and that requires a process like this rather than hoping an LLM will naturally cover the space you care about.
Even though you generated all this data using an LLM, it’s still important to review it yourself or to have somebody review it because you need to remove unrealistic combinations from the first step and you need to make sure that the synthetic data that’s generated actually seems realistic to you and reflects real usage patterns.
2. Read and Open Code
Once you have your traces (complete records of user query → LLM processing → final output), the real work begins. This introduces the open coding technique, which draws from qualitative research methodology.
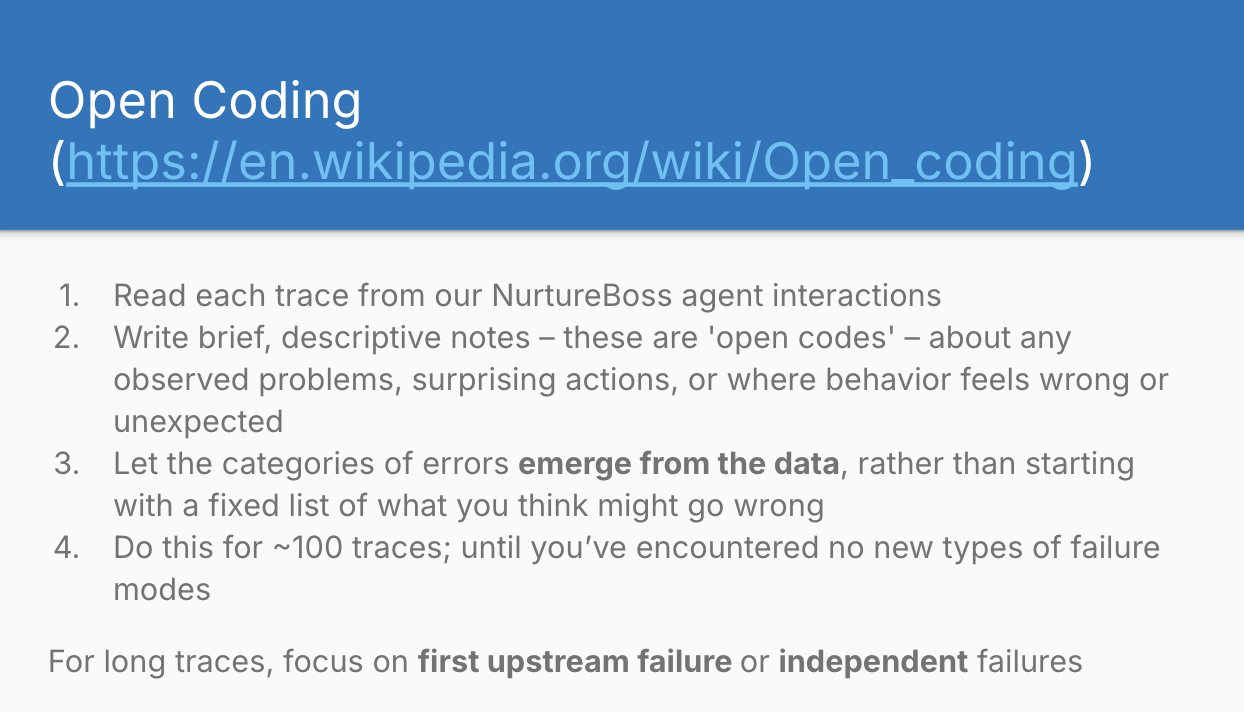
Open coding means reading each trace end-to-end and writing brief, descriptive notes about anything that feels wrong, unexpected, or problematic. You have to be disciplined and let the categories emerge from the data. If you come in with preconceived notions, you’re going to end up seeing what you expected to see and confirming your biases rather than finding genuine problems with your LLM outputs.
During the lesson they demonstrated this live using real NurtureBoss traces (on https://braintrust.dev/).
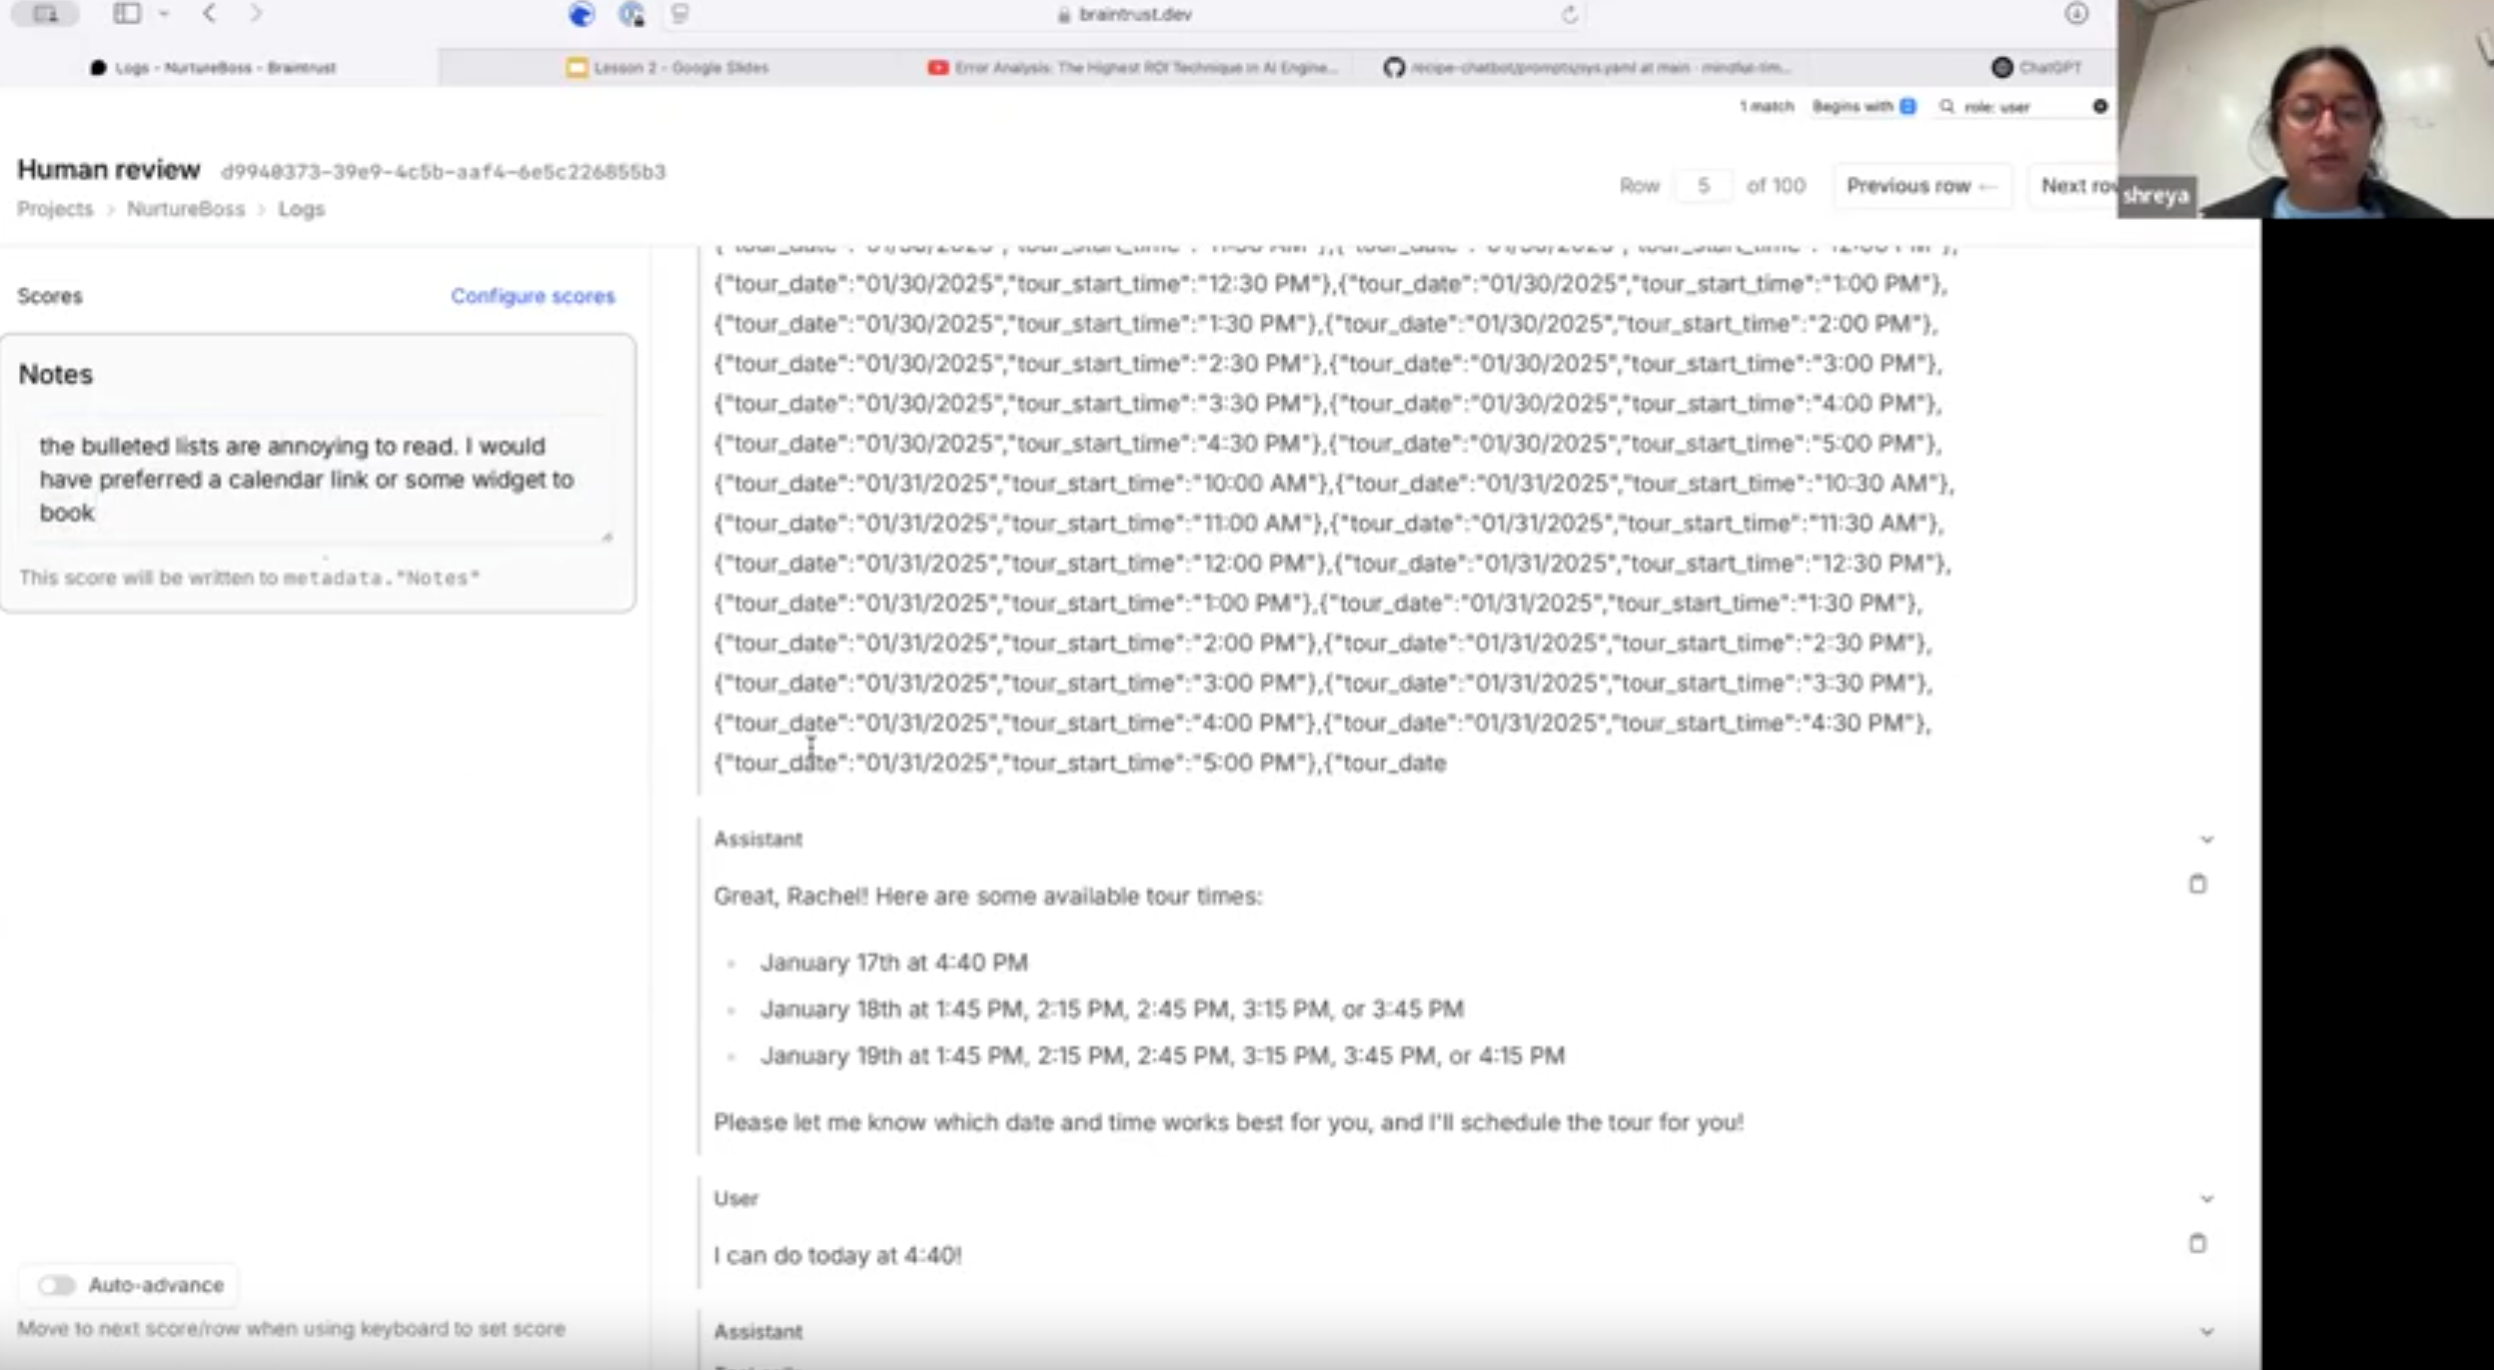
You can’t outsource your open coding to an LLM because the LLM lacks your context and your “tribal knowledge”. For example, if somebody asks about rescheduling (as in the screenshot above.), an LLM might look at that output and think it’s fine. But an opinionated product-minded person might have a specific viewpoint. For example, Hamel noted here: “This is bad UX - I want a widget here with a calendar link, not bullet points the user has to parse.”
This kind of judgement call is the stuff you can’t get from an LLM just now. It requires that domain knowledge and product intuition that only comes from understanding what good looks like in your specific context.
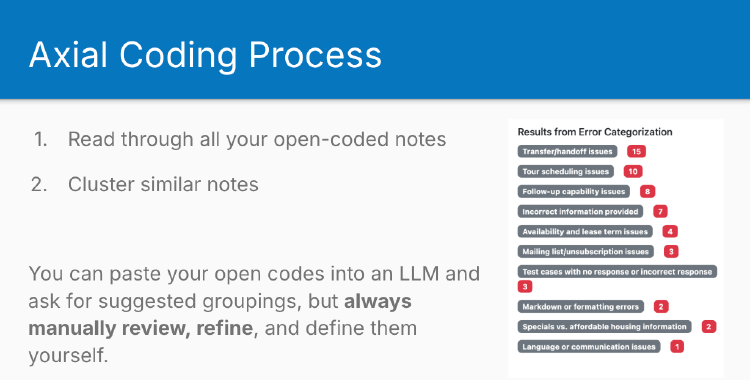
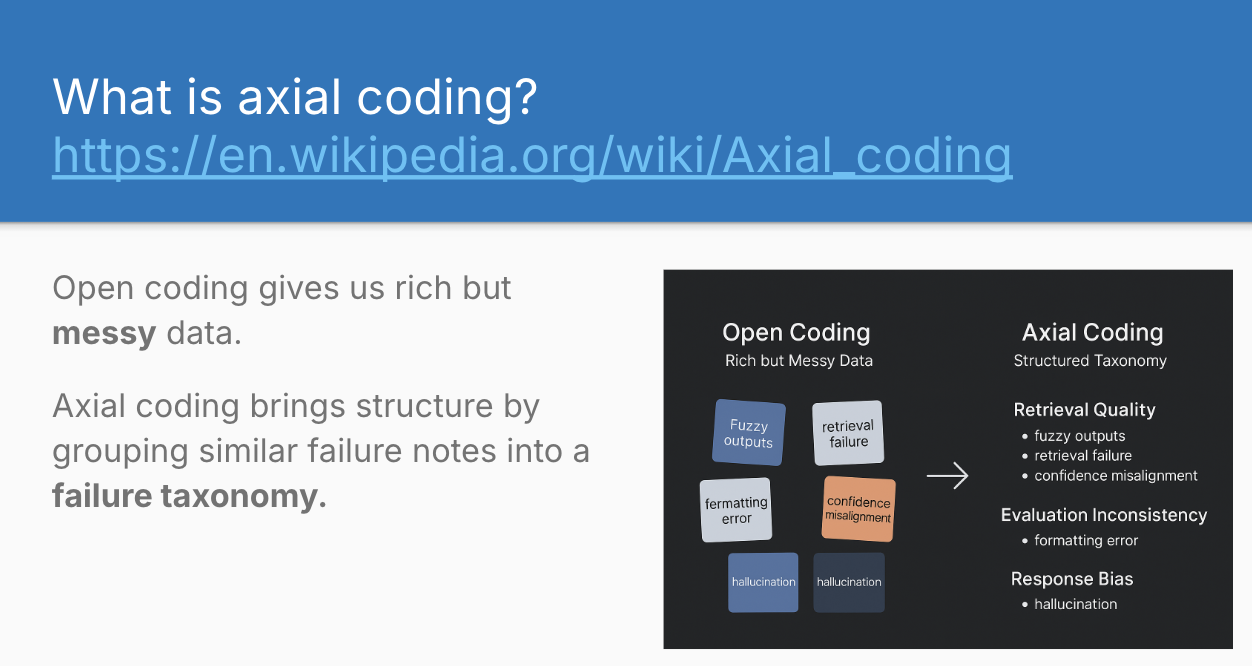
3. Cluster Failure Modes (Axial Coding)
After open coding 100+ traces, you’ll have a spreadsheet full of diverse observations. The next step structures this messy data into a coherent taxonomy of failure modes.
Axial Coding is a bit like doing an open card sort versus a closed card sort. You’ve done your open coding (like an open card sort where you write down whatever comes to mind), and now you’re taking all those notes and sorting them into piles, then giving those piles names. You’re looking for patterns and groupings that emerge from the data itself.
The process involves clustering similar open-coded notes together and giving each cluster a clear, testable definition. Each failure mode should be:
- Binary and testable
- Can be answered with clear yes/no when evaluating new traces
- Distinct
- Minimal overlap with other categories
- Grounded in data
- Based only on observed behaviours, not theoretical possibilities
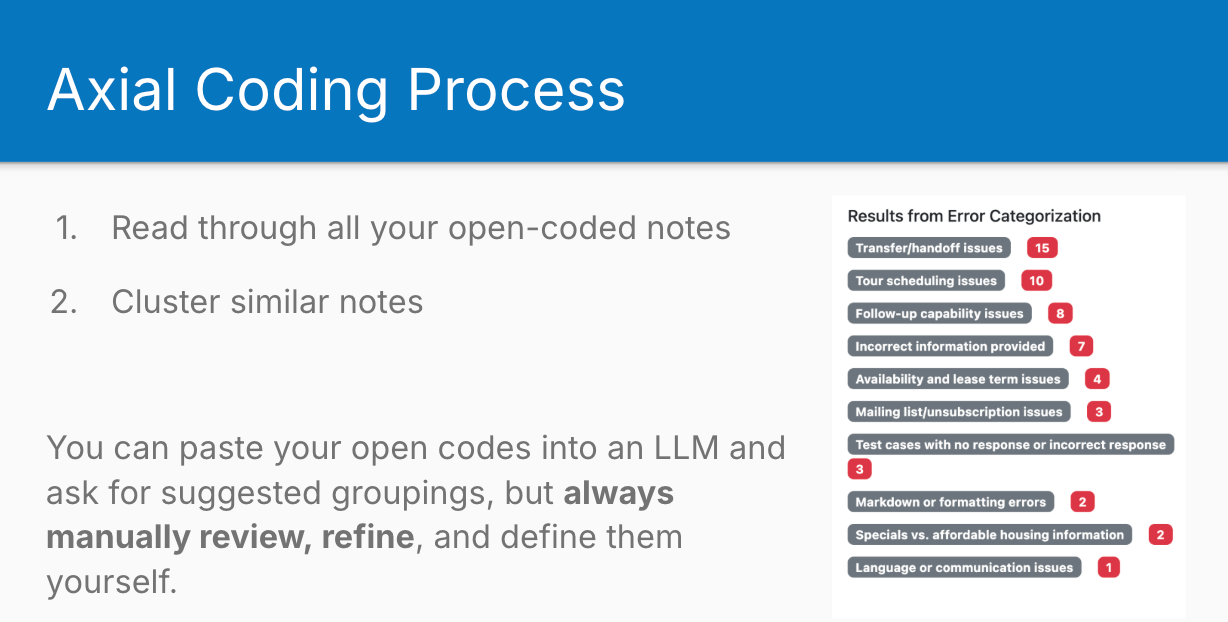
For NurtureBoss, this process revealed patterns like “Transfer/handoff issues” (15 instances), “Tour scheduling issues” (10 instances), and “Incorrect information provided” (7 instances).
Shreya and Hamel acknowledge that LLMs can assist with this clustering process - they demonstrated using ChatGPT with a carefully crafted prompt to suggest groupings. However, they emphasise that human review and refinement remains essential. The LLM provides a starting point, not a final answer.
4. Label Traces with New Taxonomy
With your failure modes defined, you go back through your traces and systematically label each one. But here’s where it gets interesting: once you’ve finished labeling everything, you have to go back and do it again. As in, you go back to trace number one and you start doing the open coding again from scratch.
This might seem odd, but you have to do it again because you’ve shifted your own understanding of the evaluation criteria. This is called evaluation criteria drift. It’s a natural thing that happens when you do any complex analytical work - your understanding of what constitutes good or bad performance evolves as you examine more data. The person who finishes this process sees the data very differently from the person who started it. Your quality standards become more nuanced, and you spot patterns you missed initially. This is why you have to do it even though you just finished doing it - you will see things the second time around that you didn’t see the first time around.
So you’ve labeled your traces, then you go back and label them again, looking for more things you might have missed with your updated understanding.
5. Iterate and Quantify
You keep doing this until you reach the point where there are no new failure modes. This is what they call theoretical saturation - when you look at the data, it doesn’t tell you anything new. You’ve already mined all the different failure modes that you’re going to get out of it.
This is where you quantify how many of each type of error you’re finding. An LLM can support you with this based on your actual coding definitions, but you’re doing this anyway as you cluster during your axial coding stage. The value of quantifying it is that it’s telling you how well your tool is performing through the lens of criteria that you yourself have defined. It’s much more meaningful to you than a generic benchmark, such as you might find in GPQA or Humanity’s Last Exam.
Common Pitfalls
The lesson concluded with several pitfalls to avoid:
- Unrepresentative data: Poor dimension selection leads to missing important failure modes.
- Skipping open coding: Jumping straight to predetermined failure categories prevents discovery of actual issues.
- Premature scaling: Using 1-5 Likert scales before establishing clear binary criteria.
- Not iterating: Stopping after the first pass misses the benefits of criteria drift.
- Excluding domain experts: Complex domains require specialist knowledge that general reviewers lack.
thingsithinkithink
-
The dimensional sampling approach for synthetic data generation is clever. It’s much more principled than “ask ChatGPT for some example queries” whilst still being practical to implement.
-
It’s not intuitively obvious to a lot of LLM Engineers why we would lean away from Likert scales and try to enforce binary yes/no answers at this stage.
- LLMs have certain patterns and tendencies around where they like to group things, just like people do.
- If you give them a 1-5 scale, they’re not really going to use the full range of that scale and they’re not going to bring the nuance required to suitably differentiate.
- We haven’t given them strict criteria on how to differentiate. It’s much harder to say “this is a 2 or this is a 3 out of 5” instead of just saying yes or no.